In today’s fast-paced business world, data is a crucial asset. Every organisation generates large volumes of data daily. Effectively utilizing data involves transforming it into meaningful and actionable information. This is where Business Intelligence (BI) becomes important.
Introduction
Business Intelligence (BI) encompasses a set of technological processes that organizations leverage to collect, analyse, and utilize data, enabling informed decision-making and supporting critical operations. It plays a pivotal role in helping organizations achieve their core business objectives. Business intelligence uses BI reporting tools to turn data into insights that can be used to make better business choices. Business Intelligence tools transform and enrich the raw data for analysis, enabling the creation of reports and dashboards.
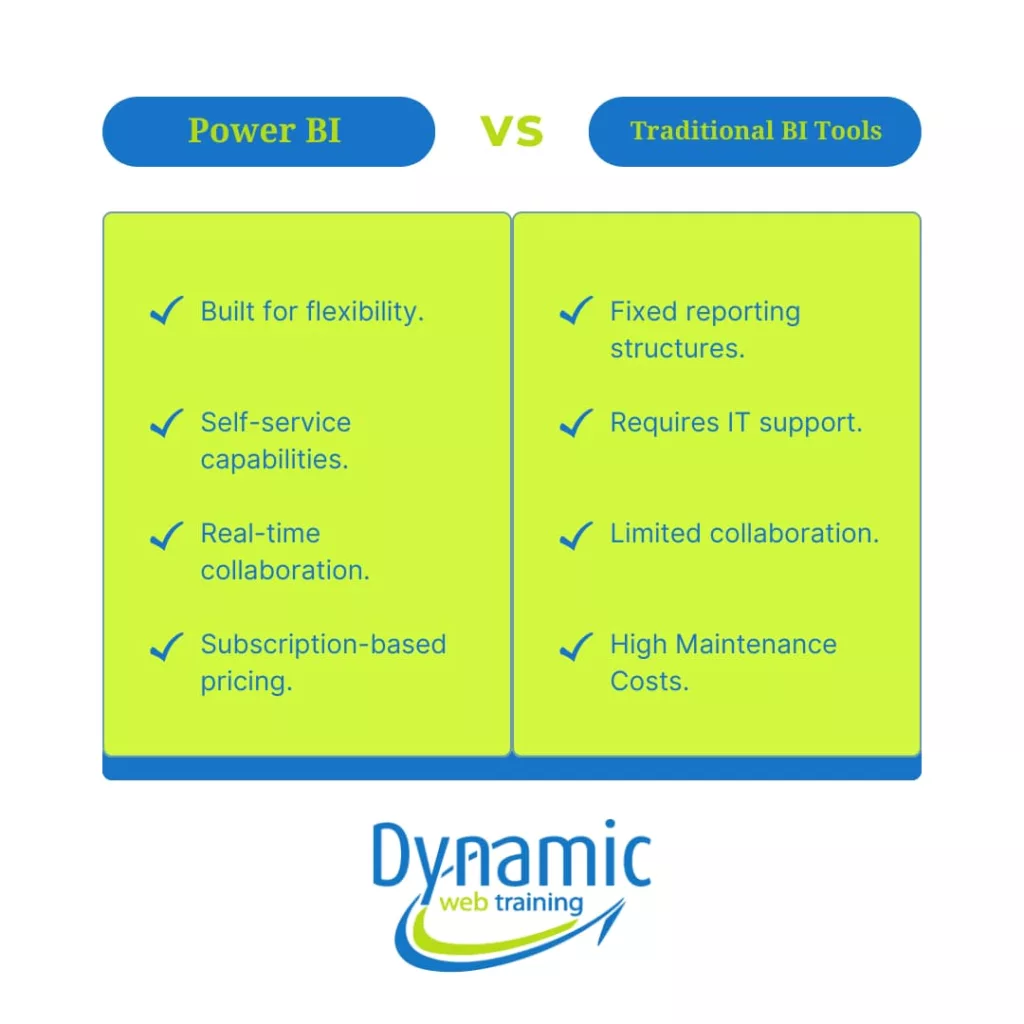
Typically, Traditional BI was a centralised and IT-controlled BI model where people were unable to leverage data fully to make their decisions. In contrast, Modern BI is easily accessible and interactive. However, identifying a suitable BI solution for your business may take considerable time and effort.
Power BI is a modern self-service BI tool developed by Microsoft with a primary focus on data analytics and business intelligence. The goal of this article is to explain the differences between, Power BI and Traditional BI tools and help you decide which is best for your company.

Complete Business Intelligence Cycle Explained
The term Business Intelligence (BI) Cycle describes the continuous process that businesses employ to collect, prepare, and analyse data for decision-making. Let’s learn more about the complete Business Intelligence process:
1. Data Collection and Integration
The first step in the BI cycle is data acquisition. This includes data collection from different sources: internal (Enterprise Resource Planning and Customer Relation Management systems) and external (Market reports and Web data). Data from several sources must be integrated into a single dataset.
2. Data Preparation and Transformation
After gathering the data, it needs to be processed and transformed for analysis. The data preparation and transformation step include removing the data inconsistencies and errors. Thereby, making it suitable form for analysis.
3. Data Modelling
Data modelling defines how different data queries relate to each other. A good data model makes it easy to analyse data because of the relationships between different tables.
4. Data Enrichment and Analysis
In this stage, the data is enriched with additional information, including derived fields and calculations.
5. Data Visualisation
Data visualisation converts data of various forms into graphical representations such as charts, graphs, and dashboards. Effective visualisation can help in better decision-making.
6. Sharing and Collaboration
Once information is analysed and transformed into visualisations, it must be presented to stakeholders. This stage facilitates the dissemination of information across the organisation for optimal utilisation. By using collaboration tools, decision-makers are in sync and have the same information in real time.
7. Decision-Making and Action
The value of the BI Cycle is realized through the decision-making stage, as data-driven insights facilitate more informed and effective decision-making. These decisions could involve operational modifications, strategic planning, or other actions targeted towards enhanced performance.

Traditional BI: Strengths and Limitations
On average, traditional BI has been in use for more than thirty years. In fact, it is still relevant in many organisations and businesses. Traditional BI provides better control over data accessibility and compliance, which is important in industries with strict regulatory environments, such as finance or health.
The traditional BI approach uses pre-built and fixed-schedule static reports. It also involves high initial capital investments in equipment, software, and IT personnel. In Traditional BI data preparation and data modelling rely on ETL (Extract, Transform, Load) and OLAP (Online Analytical Processing) tools, which require IT personnel support and do not facilitate agile decision-making.
Power BI
Power BI is a self-service BI tool in Microsoft’s suite of products. Power BI is a popular choice for businesses because of its seamless integration and user-centric approach.
Key Features of Power BI
1. User-Friendly Interface:
With Power BI’s graphical foundation, the user can drag and drop elements to create a report. Its Power Query interface allows easy data transformation. It also provides data modelling functionality with a straightforward interface where users can easily create relationships between data tables.
2. Real-Time Data Updates:
Power BI supports real-time data connectivity, so users can see changes in the reports and dashboards immediately when new data arrives in a model.
3. DAX (Data Analysis Expressions):
Power BI uses DAX to generate complex calculations and measures to enhance data analysis.
4. Cloud-Based Collaboration:
One of Power BI’s most attractive features is Cloud-Based service. Power BI also provides row-level security that helps businesses regulate which data is visible within the shared reports.
5. Frequent Updates and Innovation:
Microsoft regularly deploys updates to keep the application at the forefront of business intelligence.
Why Power BI over Traditional BI?
Power BI has been named as the leader of Gartner Magic Quadrant for analytics and BI platforms for several years. Both analysts and businesses prefer Power BI for several reasons:
- With its user-friendly interface, Power BI is accessible to even novice users, unlike traditional business intelligence tools that are only utilized by technical experts.
- Microsoft-related products like Excel, Azure, and SharePoint work perfectly with Power BI. It integrates smoothly with third-party data sources, allowing diverse data processing and visualization.
- The Power BI pricing model includes free tools as well as paid packages intended for small, medium and large businesses.
- Microsoft constantly releases Power BI updates, which help it stay ahead of the competition and make Power BI a solution that will find its way into the future.
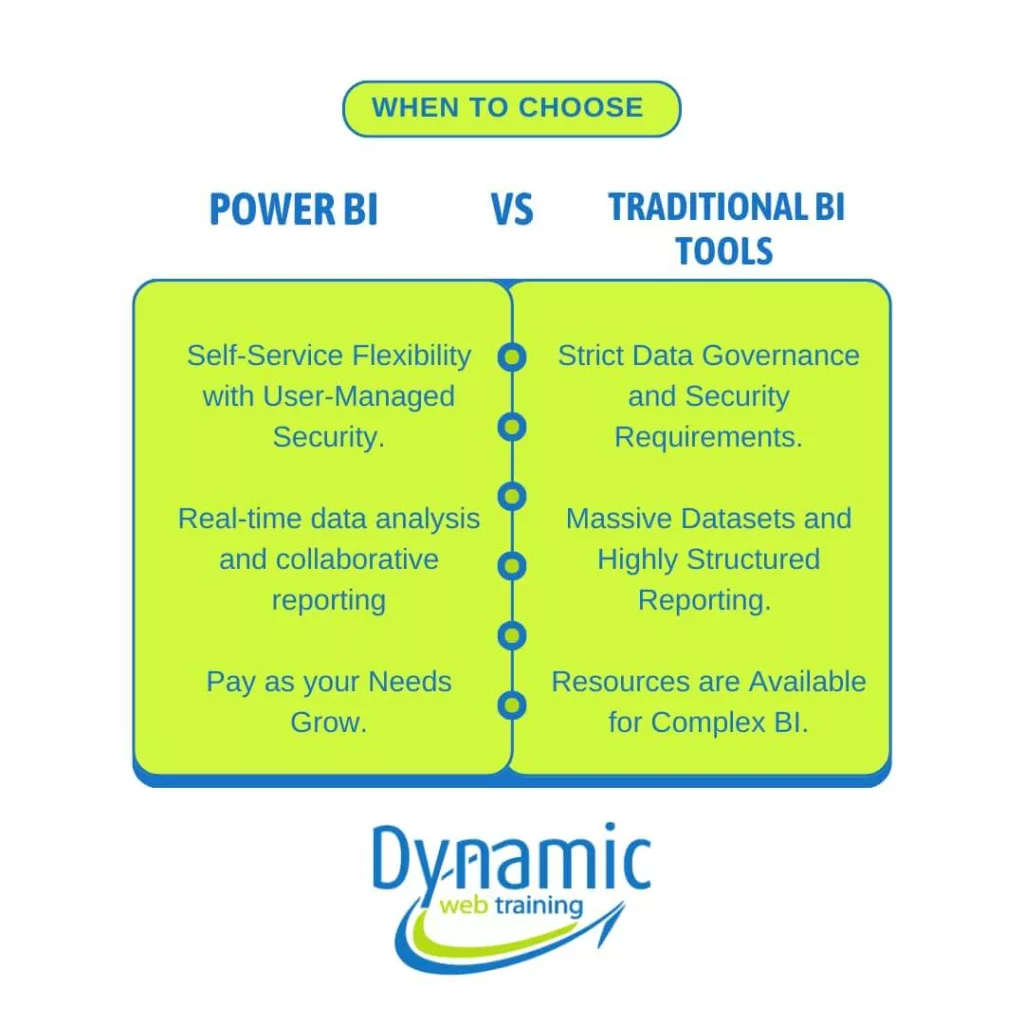
When Should You Choose Traditional BI Tools vs Power BI for Your Business?

Conclusion: Choosing the Right BI Solution for Your Business Needs
The type of BI solution you should select should meet your organisational requirements. Therefore, traditional BI may still be the answer if you need complex data management across a large organisation with strict hierarchical reporting structure. But if you require agility and accessible self-service solutions, then Power BI is your life-saviour.